A table with links to visualizations of the configurations for n = 4 ... 50 is provided. Each cell in the table at the bottom of this page contains links to data and visualizations of the known best results.
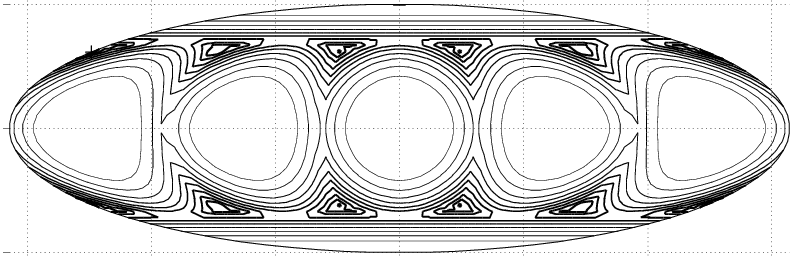
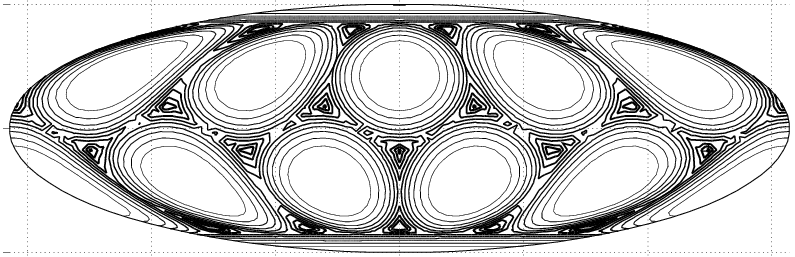
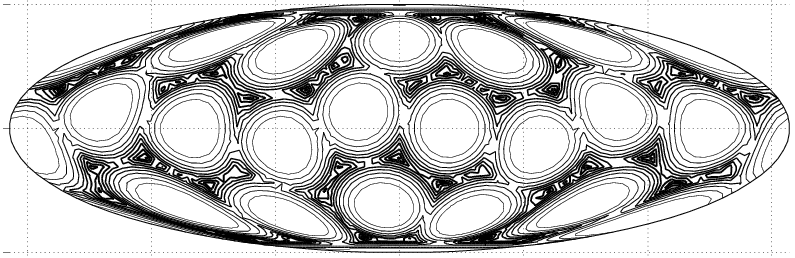
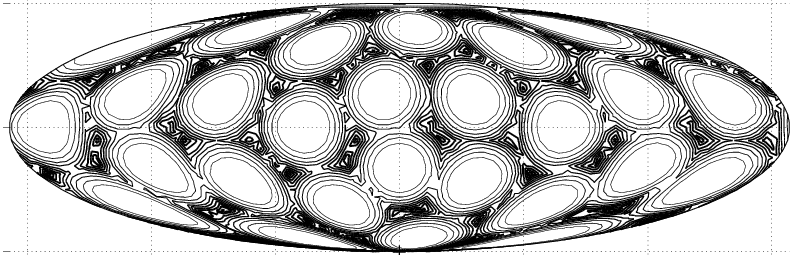
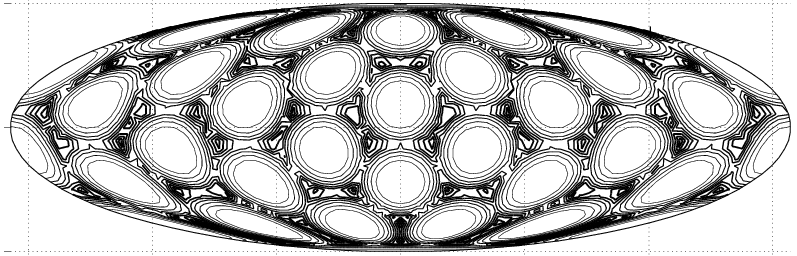
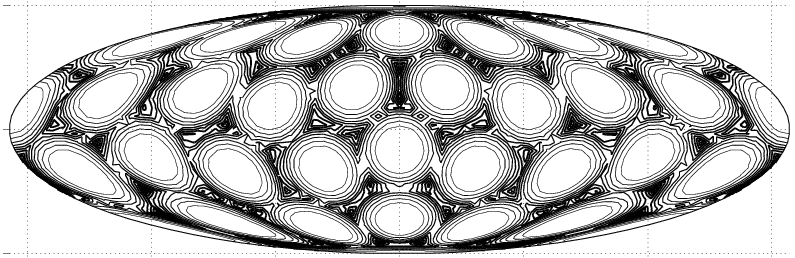
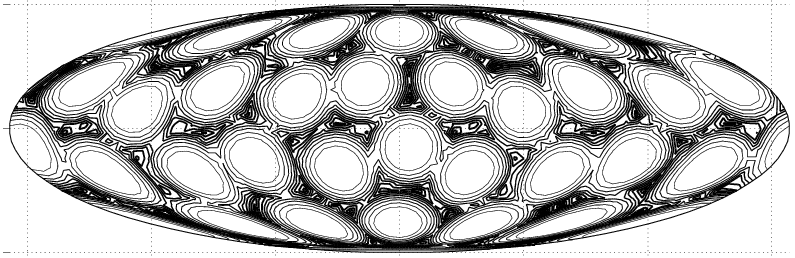
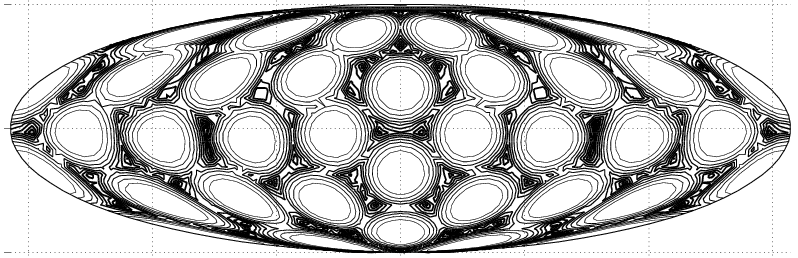
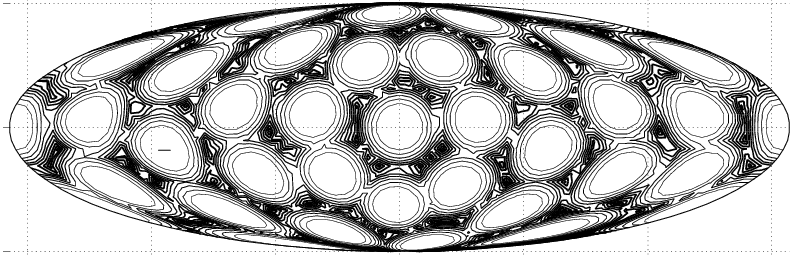
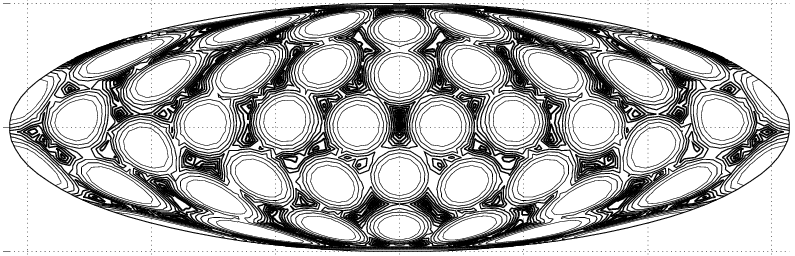
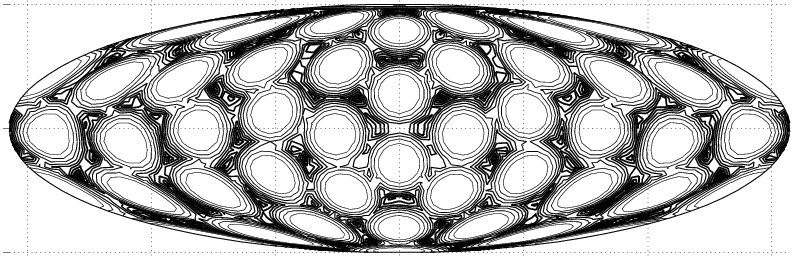
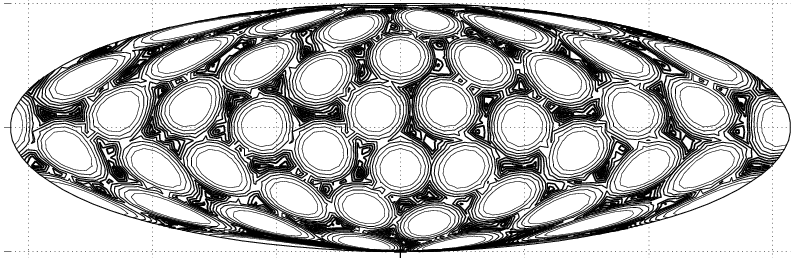
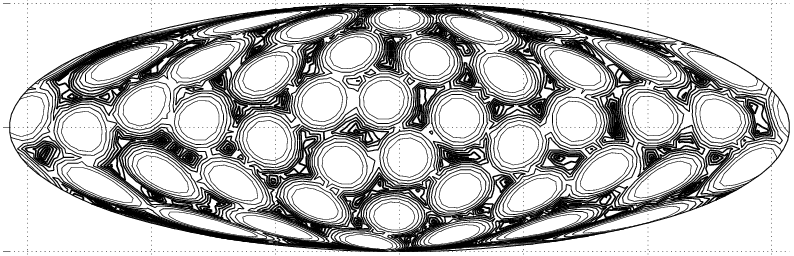
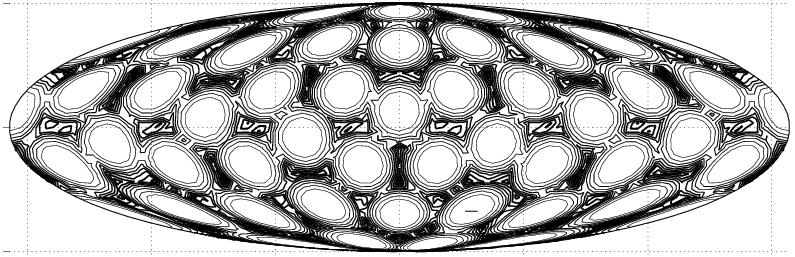
Example for n=10:
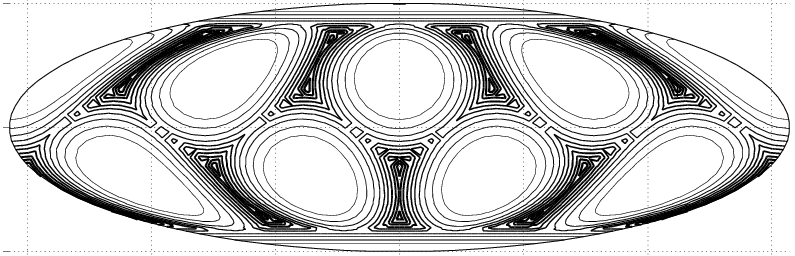
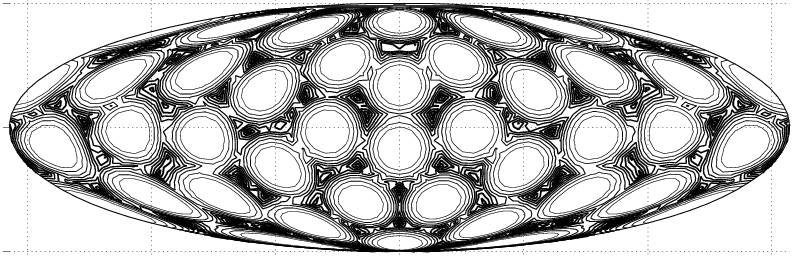
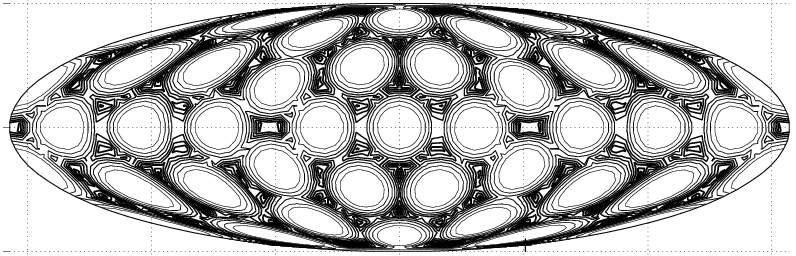
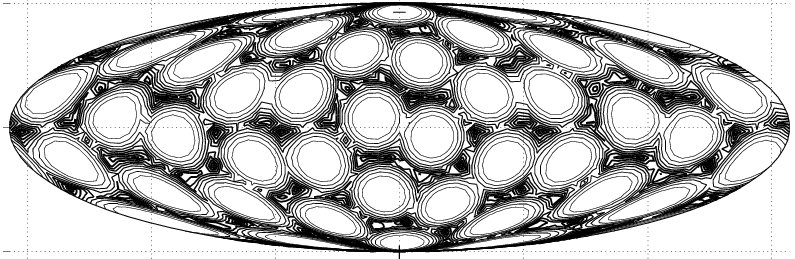
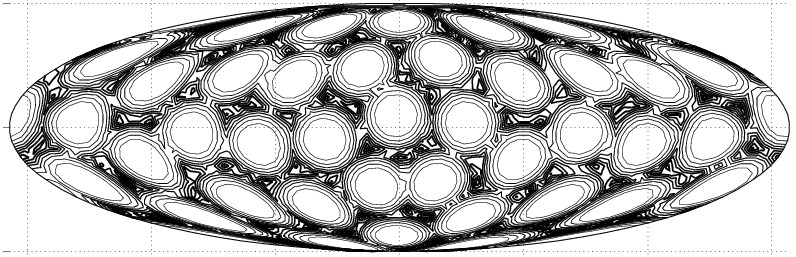
Lines of equal relative distance are shown, with iso-lines at 50, 60, 68, 74, 79, 83, 87, 91, 94, 97% of the maximum occurring distance. Ideally, the iso-lines would all be circles or parts of circles. The discontinuities visible in the plots are a consequence of the piecewice representation of the iso-lines that are created as straight line segments on an overlaid element grid. The resolution of this grid is a compromise between visual appearance and the size of the graphics files. The stations are located at the centers of the 50% distance circles, obviously corresponding to distance zero. Higher values are indicated by thicker lines. So the "dark" regions are those with the longest travel to the nearest petrol station. In the projection the equator is shown as horizontal line with the leftmost and rightmost ends representing the same position on the sphere. Therefore the circle center regions at the right and left boundary above the equator of the example picture belong to the same station on the sphere and have to be counted only once. The North pole is located at the top and the South pole is located at the bottom of the picture. In the n=10 example stations are placed at both poles.
The third (bottom) line of the cell displays the order of the symmetry group of the point configuration and the type of symmetry.
The line is a link to a table of the coordinates. The table has a header line with the number of points n and the angle ρ .
The following n lines each contain the point index i, the spherical coordinates φ, θ and the cartesian coordinates x, y, z.
Appended to the coordinate list is the information on the symmetry. The first line, separated by a blank line from the
end of the list of point coordinates, shows the order o of the symmetry group and an acronym for the group type.
The following o lines are a cycle representation of the applicable group.
The coordinates in the provided files are only approximations of moderate accuracy to those provided in Neil Sloanes Library of 3-d Coverings. The processing of the results involved a partial re-computation of the configurations. The methods applied by the author were only intended to produce an accuracy sufficient for visualization. If high accuracy is needed, it is recommended to resort to Neil Sloane's original coordinate data.